
Power BI: business analysis and data visualization |
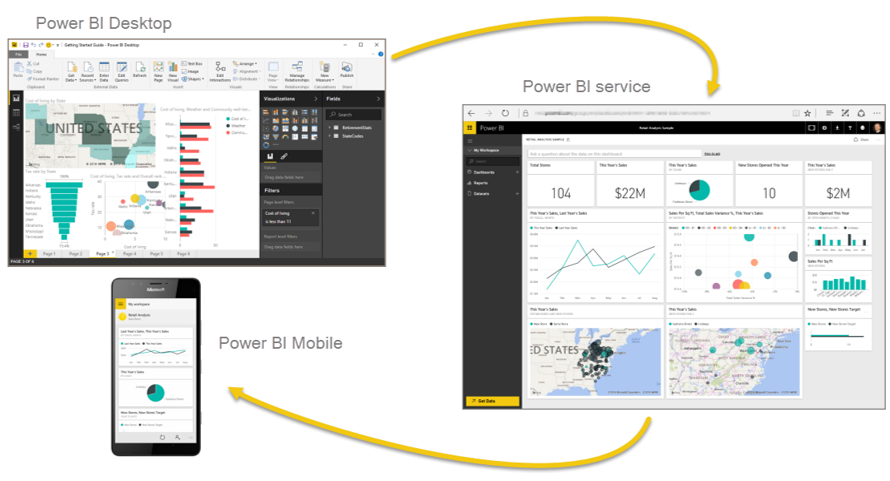
Power BI is a set of software services that work together to turn a company's unrelated data sources into interactive reports. Power BI includes: the Power BI Desktop application for creating data models and developing reports, an online service for publishing reports, and Power BI Mobile mobile applications.
Power BI: business analysis and data visualization
Speaking about Power BI, I'll start with what they are BI systems (Business Intelligence).
business intelligence, or systems with business intelligence – analytics systems that combine data from various sources of information, transform them, and present them in a visual form that is convenient for analysis. BI technologies allow processing large unstructured volumes of data for making business decisions by company management.
What is Power BI?
Power BI is a set of Microsoft software services that work together to turn a company's unrelated data sources into coherent, interactive reports. In this case, the source can be databases, Excel files, data from cloud sources and the Internet, text files, and so on.

Power BI is designed to create individual company reports, as well as presentations of companies and business plans to investors and future partners. Can be used to work within group projects.
What does Power BI include?
Power BI includes:
- Appendix Power BI Desktop to create data models and develop reports – control panels (Dashboard).
- Online service Power BI (SaaS – Software as a Service) for publishing reports.
- Mobile applications Power BI Mobile for viewing reports on mobile devices and tablets running Windows, iOS and Android.
Applying Power BI
The scope of Power BI depends on the needs of your company. There are an incredible number of opportunities for business analytics. For example, you can use Power BI for automated creation of interactive financial reports for viewing only by managers and responsible employees of the company.
As soon as you set up a connection to data sources, the sequence of processing and calculations, reports will be generated automatically. And you will no longer need to spend time creating reports every time.
Your sales colleagues can use the apps Power BI Mobile to track sales on their mobile devices. Formation of reports in real time will allow managers to quickly track changes, even while on the road. And the marketing team will be able to analyze sales (or other data, such as Google Analytics) using visual information and develop new ways to attract customers.
Via online service Power BI can publish your company's reports to attract investors and potential partners. And also view internal reporting through secure channels with the distribution of access rights.
Data visualization
Data visualization – This is the most interesting and spectacular part of Power Bi.
And this is besides the advantages that we talked about:
- connection to various sources of data directly;
- All data is combined in one report – it is not required to view different reports to see the picture for the company as a whole;
- The recorded sequence of processing and calculations – calculations do not need to be repeated and routine monotonous work, they will be formed automatically;
- The ability to work in real time.
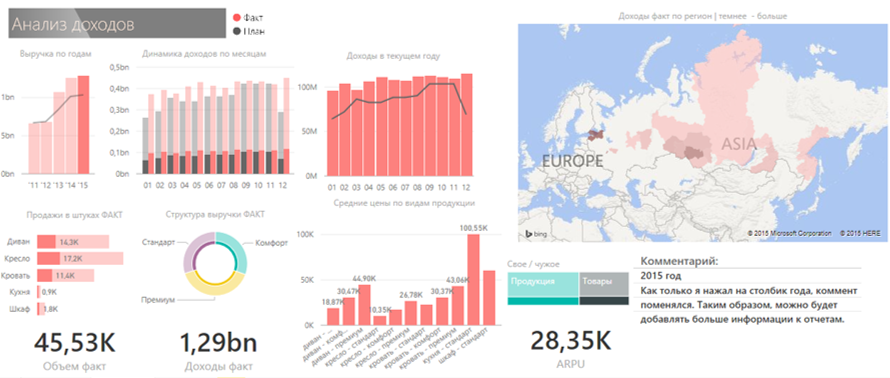
Data visualization – This is the final result of the work in Power Bi, which will allow you to clearly and interactively track the basic trends, dependence and deviations of indicators. This is an opportunity to effectively present the company and clearly show the owners and managers the results of the work. And an understandable report is what you need to make the right business decisions.
Power Bi includes many visualization tools – graphs, linear diagrams, circular diagrams, accumulation diagrams, combined diagrams, waterfall and funnel -shaped diagrams, sensors, speedometers, point and bubble charts and much more.

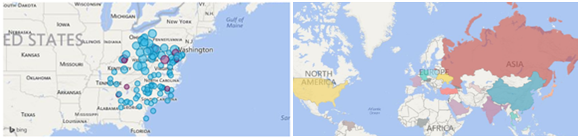
We recommend paying attention to geographic Maps – They are suitable for analyzing large companies with units in different cities and regions, as well as to evaluate working with suppliers and buyers both domestically and around the world.
While creating control panels (Dashboard) You will like cuts, cards with one number and multi -line cards, tables, as well as inserting autonomous images. As you can see, there are a lot of visualizations. But if it still seemed to you that they are not enough, you can download more. Or write them themselves in the language of R.
We visualize the data and combine it on one information panel – Dashboard, with the possibility of further detailing one click on one mouse.
Power Bi work sequence
The creation of reports begins with their development in Power Bi Desktop. Then reports are published using a secure online Microsoft service. After that, they become available on mobile devices running Windows, iOS and Android using Power Bi Mobile.
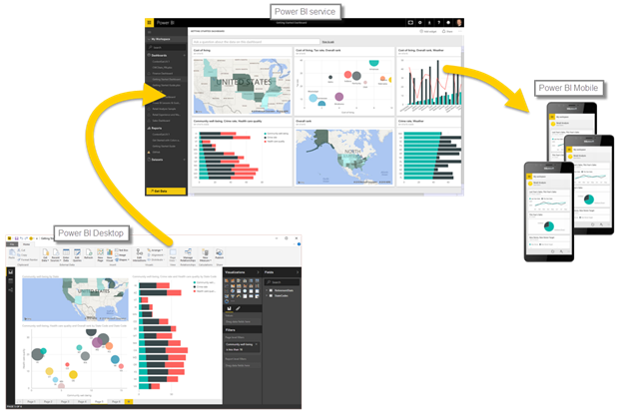
If you do not want to publish online reports, users within the company can view them using Power Bi Desktop. We remind you that this application can be downloaded and used for free.
What knowledge is needed to work with Power Bi?
So, what do you still need to know in order to work efficiently with Power Bi? I want to note that BI technologies have advanced very much, and now for work it is not necessary to be a professional in the field of databases, writing SQL queries, etc. The Microsoft Power Bi application includes tools that are already used for business analytics in Excel – superstructures Power Query and Power Pivot . And, of course, you need to learn how to work with the Power Bi application itself. You will also need knowledge DAX formulas (Power Pivot superstructure).
I think everything will be simple for you if you are already familiar with these superstructures. If not, then you need to urgently learn.This knowledge is needed not only for working with Power Bi, but also for calculations with the help of all the long -familiar Excel.