
Content analysis: how Yandex Metrics content analytics works
How to analyze content using Yandex.Metrica? What data is displayed in the content statistics? How to set up content analytics?
Yandex.Metrica provides a detailed statistical analysis of the content on the site: which articles generate traffic, which channels visitors come to pages from, which posts are popular with the audience, whether people finish reading the materials. Content statistics help to understand whether the topics are of interest to the target audience, which categories bring conversion, and what should be excluded. Reports support all text formats – longreads, posts, reviews, questions and answers, etc.
Related Material: 7 Important Content Marketing Techniques — What to Learn from the Entertainment Industry
How to get statistics on content
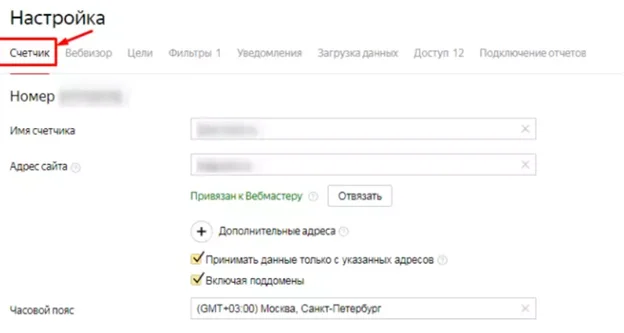
The main condition is that in the settings of the Metrica counter, you must enable the “Content Analytics” option. To do this, select the appropriate counter and click on the “Settings” button:

Then click on the “Counter” tab:
In the menu, find “Content Analytics”, click on the tab and select the type of microdata used on the site:
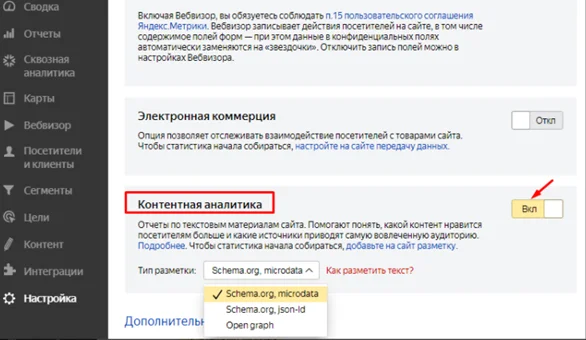
If there are two types of microdata on the site at the same time, then indicate the preferred option. For turbo pages, you do not need to select markup.
So, the main conditions for collecting statistics on content:
- one counter must be set for both site and turbo pages;
- the same identifiers and titles are configured for standard and accelerated resource pages;
- to identify a rubric, breadcrumblist markup must be used.
In order to receive full content analytics, you need to install the Metrica code on all pages that you need to track. To do this, go to the counter settings and copy the code.
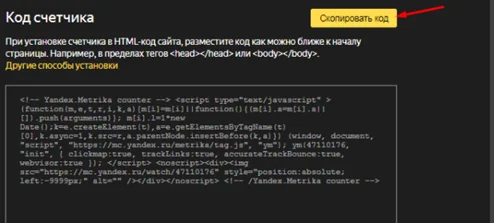
You can add code using HTML for each page, through special plugins for CMS, or use Google Tag Manager.
Related material: Setting up the Yandex.Metrica counter: setting, setting up goals and reports
How to analyze content using Metrica
You can view content analytics in the “Content” section. Two report options are available to users: summary and standard.
1. “Summary”
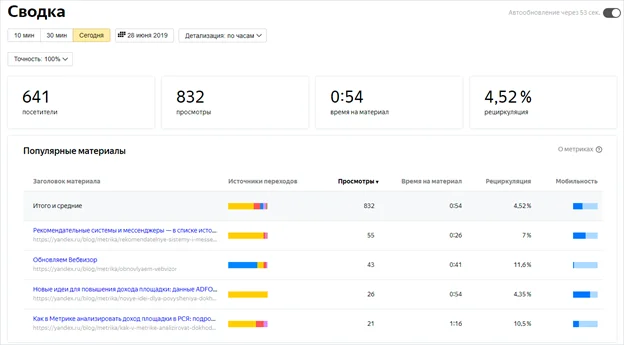
The “Summary” tab contains brief statistics on content for the day. The data helps to evaluate the behavior of users on the site at this particular moment:
- how active the audience is;
- which publications are popular with visitors;
- Where users came to the page from (from social networks, organic search, PPC, etc.).
You can generate statistics on content for a specific time period: 10 minutes, half an hour or a day. You can also configure auto-update, then the data will be updated every 60 seconds.
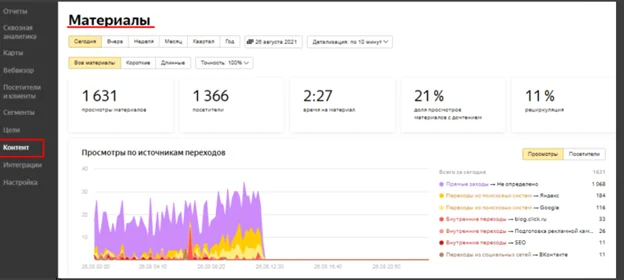
Summary displays the following metrics:
- number of site visitors;
- how many people viewed the material and how many publications were viewed by one user, if there are a couple of articles on the page;
- content view time;
- recycling – the percentage of users who, after reading one publication, went to another page;
- Distribution of views depending on the transition channel.
To view detailed statistics for a particular article, you need to click on the title of the article. The service will automatically switch from “Summary” to the “Materials” tab. Here you can see data on the number of views, visitors and traffic channels. This is convenient, since the analyst does not need to move from one report to another to view detailed statistics for a particular article or advertising post.
The “Summary” report allows you to evaluate what content is read more often by visitors, what topics are of interest to the target audience, and which ones are not worth spending time on, and also which posts recorded the maximum transitions for a specific time period.
2. “Materials”
In this report, you can get statistics on published content and compare publication performance with each other. To view the data, you need to go from the “Content” section to the “Summary Reports” – “Materials” tabs.
You can request data for the last day, yesterday, week, month, quarter, or year. Detailed information depends on the time period selected by the user. Let’s say an analyst requested a report for a day, then the statistics can be detailed for every 60 seconds, 10 minutes, or by hours. If you need a report for a week or more, then the detailing is done by hours and days.
Reports “Materials” allows you to find out:
1. How useful is the content for the target audience
The time of interaction with the publication will show how much time users interacted with the content: they read the text of the material, navigated through the interactive elements, watched the video, and so on. The higher the engagement rate, the higher the interest of the audience.
See statistics on the depth of content viewing and content reading. If users scroll through the article quickly, it means that the text is not being read. Perhaps the topic is interesting, but the content looks boring, you don’t want to read: there are no headings, paragraphs, images.
The Reading Funnel will show you how far users have read a post. The data helps to find where in the article there is a “weak spot” that needs to be improved.
2. Find out from which devices users read materials more often
Users don’t read posts in the same way. It depends on the type of device from which it is easier to do this. It is important to evaluate how many views are accounted for by visitors from smartphones and compare with engagement rates. Let’s say the share of mobile traffic is above average, but people close the page without reading the material to the end. Perhaps the point is that the content is not displayed correctly on smartphones or other gadgets. In this case, it is necessary to refine the layout and adapt the content for reading from mobile devices.
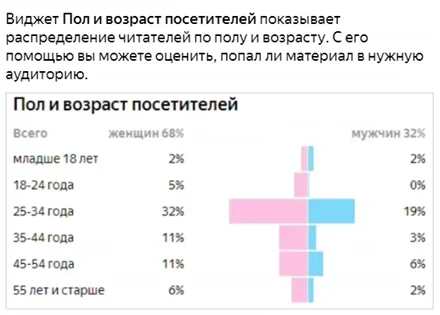
3. Get to know your target audience better
The metric will show who reads materials more often: women or men, students or pensioners, and so on. Thus, the analyst will understand whether the content hits the right audience.
4. See what posts users go to after reading a specific article
To get this information, you need to open the Content Transitions widget. The information will help you understand what materials it is better to add linking to.
3. “Headings”
In the report, you can view statistics by headings of the corporate blog. To see indicators by content, you need to open the “Summary Reports” tab and click on the “Headings” section.
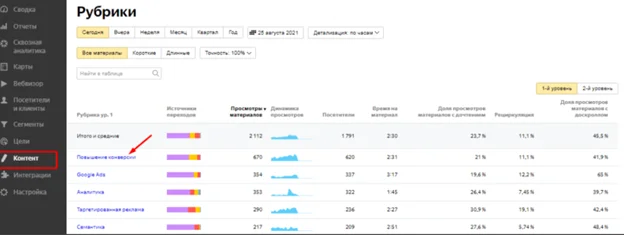
In the report, the data is presented as follows:
- By site. This is a summary of content statistics by category. The analyst will be able to identify popular sections of the blog, see what channels visitors come from (internal referrals, from social networks, search engines, and so on), determine the percentage of the audience that moved from a particular category to another or further to the site.
- For a specific rubric. Content analysis helps identify top content. Taking into account the interests of the audience, you can draw up or adjust the content plan.
The “Categories” report helps to close such tasks:
- Determine which categories are generating traffic and which are not. To do this, you need to analyze the indicators of involvement of the target audience of the content. If most of the articles in the rubric are not read or not opened at all, it means that users are not interested in the rubric and it is not worth wasting time searching for topics and informational reasons for this section. Focus on what brings more traffic and conversions.
- Determine the interests of the target audience. Above average engagement rates for specific categories will help you understand what the reader is interested in. It is better to track in dynamics: last month, users were interested, for example, in the topic of SEO promotion, and this month, SMM and PPC. This helps to keep abreast and quickly adapt to the expectations of the target audience.
- Find out which authors write best on a topic. To do this, you need to open the Popular Authors widget, it stores information whose articles are constantly read by visitors.
A content analyst can see which sections and who reads more often. Information can be found in the Gender and Age of Visitors widget. The data helps to understand how best to change the presentation of materials, or the style of presentation. Perhaps nothing should be changed if the content falls into the audience of the blog.
The report also shows the distribution of traffic by page format: desktop, mobile, or turbo. The information helps to understand which types are best to work with.
4. “Authors”
Analyst can view statistics for a particular author by clicking on the name in the list of copywriters or journalists. For each employee, the sum of publications and the number of readings of materials will be displayed. Use the content length filter in Yandex.Metrica to find out which authors write short news and which ones write long reads.
In order for the data to be displayed correctly, publications must have the correct micro-markup – Schema.org or Open Graph.
The report helps to evaluate the work of the editorial staff. If the level of involvement is below the norm, then you need to find new topics for publications, work with authors – perhaps someone writes worse, and therefore coverage is falling.
5. “Themes”
Analysis of content by “Themes” will help to understand the interests of the audience. It is important that micro-markup is present on the pages, otherwise the data will not be displayed correctly. Here you can also see popular authors in a specific topic, the level of involvement of visitors, as well as data on those who viewed the material – gender and age of visitors.
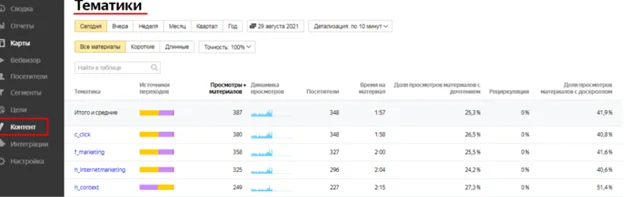
The information stage helps to understand in which direction it is better to develop a blog.
Related material: Types of content for website promotion: TOP-5
Why statistics in content analytics and other Metrica reports may differ
- Make sure your site has the tag code set. This can be checked in the page code, if configured correctly, the library will be connected – https://mc.yandex.ru. metric. tag.js.
- The service takes into account the transition channels for each view of publications, and not for visits, as in other Yandex Metrica reports. If the user went to the main page of the site from a search engine, and then clicked on a specific article, then in other Metrica reports, the visit channel is organic search, and in content statistics, it is an internal transition.
- The number of views of posts and pages may differ for the following reasons:
- The content view is short and the service didn’t catch it. In this case, page views could be counted.
- Posts less than 500 characters long do not count, except for markup for short articles (question and answer).
- The content reports show information about tagged posts and turbo pages. Other accelerated page formats are not taken into account. In other Yandex Metrica reports, data is entered on all pages of the site, including those where there is no markup.
Related material: Yandex.Metrica webvisor: features and life hacks
Want to learn more about quality content? Get to know Exiterra’s content marketing service.